 M.S. Kapadia
 takes a close look at the performance of the power sector during FY13. While there has been overall progress on various counts like addition of new generation capacity, T&D infrastructure and containing power deficits, availability of fuel for thermal power plants is a major issue that needs to be resolved soon. The disparity between fuel and electricity pricing for coal-fired power plants is growing, feels the authors, and this could have adverse bearing on efficient usage of new power generation capacity.
Fiscal 2013 ended on an encouraging note in power capacity augmentation, according to CEA compilations. The addition to conventional power capacity of 20,623 mw during the year has exceeded the 17,956 mw targeted for the year. Even as nuclear drew blank against 2,000 mw planned for the year and hydropower underperformed with 501 mw (802 mw), thermal saw addition of 20,122 mw, surpassing 15,154 mw yearly target by a wide margin. The addition to new and renewable energy sources, most of it in private sector, was assessed at around 3,038 mw during the year as per data provided by MNRE, lifting the total addition in power infrastructure to 23,467 mw, which is lower than 26,001 mw in the fiscal 2012, the last year of the 11th plan, but vastly better than 14,228 mw added two years back.
Untitled Document
|
Addition to Generation Capacity (MW) |
|
|
2010-11 |
2011-12 |
2012-13 |
|
Thermal |
10,371 |
18,529 |
19,927 |
|
Coal |
9,720 |
18,104 |
18,199 |
|
Gas |
651 |
425 |
1,729 |
|
Diesel |
0 |
0 |
0 |
|
Nuclear |
220 |
0 |
0 |
|
Hydropower |
704 |
1,423 |
501 |
|
Renewables |
2,933 |
6,049 |
3,038 |
|
Total |
14,228 |
26,001 |
23,467 |
The total grid-connected installed capacity at the end of the year was placed at 223,344 mw; comprising 27,542 mw (12 per cent) from rapidly rising non-conventional power and 88 per cent from conventional power Thermal power (mainly coal-fired) constituted over three-fourths, large hydro a fifth and nuclear just around 2 per cent of conventional power. The share of non-conventional energy that comprises small hydropower, wind power, solar power, biomass/biogas and industrial/urban waste in total public utilities, has doubled from around six per cent six years ago. In addition, distributed non-grid power capacity (non-conventional like solar photovoltaic systems and biomass gasifiers) was assessed at 36,000 mw at the end of the fiscal 2013. Grid-interactive captive generation capacity in industries having demand of 1 mw and above was estimated to be 34,444 mw, as of March 2011.
Around 35 per cent of conventional power capacity is in western region, followed by 28 per cent in northern region, 22 per cent in southern region, 14 per cent in eastern region and only 1 per cent in northeastern region. Western region leads in thermal power and northern region in hydropower. Southern region leads in renewable energy sources, followed by western region and northern region.
The ongoing XII plan ending FY17 has targeted a capacity addition of 118,537 mw, comprising 72,340 mw from thermal, 10,897 mw from hydropower, 5,300 mw from nuclear and as much as 30,000 mw from RES; which would include 15,000 mw from wind, 10,000 mw from solar, 2,100 mw from small hydro and the balance from bio-power, etc. The share of RES in power capacity is projected to increase to 17 per cent by 2017 and 33 per cent by 2030. The share of fossil-based thermal power is expected to decline from 66 per cent to 64 per cent and 45 per cent and large hydro from 20 per cent to 15 per cent and 13 per cent, respectively over this period. However, nuclear power would enhance its share from 2 per cent to 4 per cent and 9 per cent, respectively. According to official statistics, as of March 31, 2013, 24 per cent of the total hydro potential of 148,701 mw 24 per cent was developed, 8 per cent was under construction, and as much as 68 per cent remained to be tapped. Most of the untapped portion was in northern region and north-eastern region.
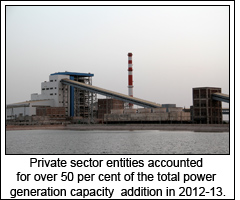
Marking a major change from pattern till recently, private sector has been adding more capacity than public sector. It added 11,258 mw (56 per cent of total) in FY13. In the preceding year also, private sector had added 11,445 mw, accounting for 53 per cent of the total addition during the year. In public sector, Central government-owned power agencies added 5,397 mw and state government agencies 3,968 mw. Private sector, which added 23,012 mw in the XI plan, comprising 41 per cent of total conventional power capacity augmentation over the plan is called upon to add capacity of 46,825 mw, which would be 53 per cent of total addition of 88,537 mw under conventional power. In addition, bulk of 30,000 mw addition to RES would also be at the behest of the private sector.
At the end of the fiscal 2013, private sector accounted for 31 per cent of the total grid interactive generating capacity in the country; Central government accounted for 29 per cent and the states/UTs 40 per cent.
Untitled Document
|
All-India Generating Capacity as on 31 March 2013 (MW) |
|
|
Hydro |
Thermal |
Nuclear |
RES (MNRE) |
Total |
|
Centre |
9,459 |
51,121 |
4,780 |
0 |
65,360 |
|
State/UTs |
27,437 |
57,939 |
0 |
3,748 |
89,125 |
|
Private |
2,595 |
42,471 |
0 |
23,794 |
68,859 |
|
Total |
39,491 |
151,530 |
4,780 |
27,542 |
223,344 |
Generation
Power generation increased by 3.5 per cent during March and 4 per cent during the fiscal 2013. The growth rate in the last quarter at a little over 2 per cent was the lowest among the four quarters of the year, with the best feat of 6+ per cent recorded in the first quarter; which fell to around 2.8 per cent in Q2 and rebounded to 4.4 per cent in Q3.
During the period April 2012 to March, 2013, All-India generation was 912.1 BU compared to 876.9 BU in the last year giving a growth rate of 4 per cent. Thermal generation was 760.7 BU compared to 708.81 BU in the last year; giving a growth of 7.3 per cent. Nuclear generation was 32.9 BU (+1.8 per cent. Hydro generation declined by 12.9 per cent to 113.7 BU and Bhutan Import by 9.3 per cent to 4.8 BU.
The 4 per cent growth in power generation during the year was half of the rate during the fiscal 2012 and also much lower than around 5.8 per cent average during the earlier two years. The fall in the growth rate during the fiscal 2013, compared to the same in the preceding year, was due to 13 per cent drop in hydropower, compared to 14 per cent increase in the fiscal 2012 due to deficient monsoon; and slower growth in nuclear (1.8 per cent, against 22 per cent sharp increase). Thermal, the main generation source, improved the growth rate from 6.5 per cent to 7.3 per cent. The performance of hydropower is decidedly conditioned by southwest monsoon and adequacy of water in reservoirs. Out of the first thirteen years of the new millennium; hydropower showed increase in seven years and decline in six years (relative to respective preceding years).
Despite the increase in rapidity, thermal power recorded a lower plant load factor (PLF) of 69.93 per cent during the fiscal 2013, as compared to 73.47 per cent in the preceding year. Gas shortage till February caused a loss of generation of 73 billion units which contributed to decline of 28 per cent in power production and a much lower PLF of 40.28 per cent (59.91 per cent) at gas turbine based thermal during the fiscal. Coal shortage and its poor quality caused 17.67 billion units, back down/shutdowns 13.37 billion units and transmission problems 1.93 billion units in thermal power. During the month of March 2013 only 84 per cent of the total requirement of coal was available. The thermal power stations received about 40.6 million tonnes of coal against the demand of 48.4 million tonnes. On 31 March, 21 TPS had critical coal stock i.e. less than 7 days. Out of these 12 TPS were having coal stock of less than 4 days. The total generation loss in thermal power due to various problems was placed at 106 billion units for the year. In nuclear power, though the rate of increase in generation dropped to 1.8 per cent, the PLF improved from 76.9 per cent to 78.5 per cent.
Untitled Document
Transmission Lines |
|
Unit |
End of |
Expected |
|
|
XI Plan |
During XII Plan |
End of XII Plan |
| HVDC Bipole lines |
ckm |
9,432 |
10,340 |
19,772 |
| 765kV |
ckm |
5,730 |
27,000 |
32,350 |
| 400kV |
ckm |
113,367 |
38,000 |
151,367 |
| 220kV |
ckm |
140,164 |
35,000 |
174,945 |
| Total |
ckm |
268,693 |
110,340 |
378,334 |
Substation |
| 765 kV |
MVA |
25,000 |
149,000 |
174,000 |
| 400 kV |
MVA |
151,027 |
45,000 |
192,562 |
| 230/220 kV |
MVA |
223,714 |
76,000 |
299,434 |
| Total |
MVA |
399,801 |
270,000 |
665,996 |
HVDC |
| Bi-pole link capacity |
MW |
8,000 |
19,250 |
26,000 |
| Back-to-back capacity |
MW |
3,000 |
0 |
3,000 |
| Total |
MW |
11,000 |
19,250 |
29,000 |
Thermal generation was up by 12.5 per cent more in eastern region and 9.3 per cent in Western region, even as it was lower than last year in north-eastern region. Central government owned public utilities had PLF of 79.2 per cent, state agencies 65.6 per cent and private sector 64.1 per cent. Even as the growth rate in nuclear generation fell steeply to 1.8 per cent during the fiscal 2013 from 22+ per cent in 2011-12, PLF at six nuclear stations improved to 78.5 per cent (76.9 per cent). Improvement in PLF was confined to Madras and Narora APS of Nuclear Power Corporation of India.
 Transmission & Distribution
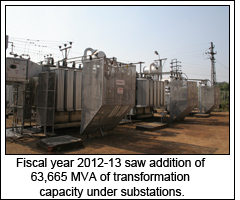
Fiscal 2013 saw addition of 17,103 ckm of transmission lines and 63,665 MVA of transformation capacity under substations, which took the installed capacity to 118,081 ckm of 400kV transmission lines, 140,517 ckm of 200kV transmission lines, 167,822 MVA under 400kV substations and 24,2894 MVA under 220kV substations. The XII Plan has targeted an addition of 110,340 ckm of transmission lines, 270,000 MVA under substation and 19,250 mw of bi-pole link capacity.
Creation of a National Grid
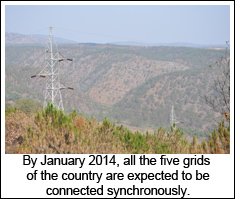
The power system in the country is demarcated into five regions. Four regional grids have been operating in synchronous mode as a single system for the past few years. Only the southern grid is yet to be connected to the rest of the system. The high voltage link to connect southern grid is under construction and likely to be completed by January 2014. Once this is achieved, all the five regional grids will operate as a single system in synchronous mode. This will be the largest single such system in the world, both in terms of the grid size and system capacity of around 200,000 mw, though, at a given point of time, actual power flow may be lower than this level.
The capacity for transfer of power across regions at the end of the 11th Plan is about 27,750 mw and this is expected to increase by 136 per cent to 65,550 mw by the end of XII Plan. The specific line which is under construction for connecting the southern region is the Raichur–Sholapur 765kV line. In fact, these are two single circuit lines and the total transmission capacity of these two lines would be about 4,200 mw. Three HVDC systems and a number of 765kV lines and substations would be implemented during XII Plan.
Untitled Document
Power Generation |
|
Year |
bln kwh |
% chg |
|
| 2003-04 |
558.3 |
5.0 |
|
| 2004-05 |
587.4 |
5.2 |
|
| 2005-06 |
617.5 |
5.1 |
|
| 2006-07 |
662.4 |
7.3 |
|
| 2007-08 |
704.5 |
6.4 |
|
| 2008-09 |
723.8 |
2.7 |
|
| 2009-10 |
771.6 |
6.6 |
|
| 2010-11 |
811.1 |
5.1 |
|
| 2011-12 |
876.9 |
8.1 |
|
| 2012-13 |
912.1 |
4.0 |
|
Energy Deficit
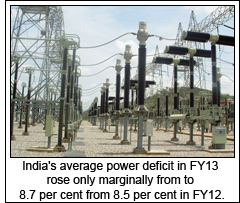
Despite a lower pace in ex-bus power availability, the average power deficit over FY13 rose only marginally from 8.5 per cent to 8.7 per cent due to subdued economy and power requirement. The deficit of around 8.1 per cent during April-June escalated to 9.1 per cent during July-August due to delayed monsoon, The deficit eased to around 8.7 per cent during September-October, increased to 9+ per cent during the next three months but came down back to 8.7 per cent during February-March. Taking the longer period, average power shortfall had peaked at 10-11 per cent during FY09 and FY10 and bottomed out at 6.2 per cent during 1999-00. The peak demand/supply deficit eased to 9 per cent during FY13, from 11 per cent in FY12, 10 per cent two years back and 13+ per cent during 2009-10.
Power-intensive western region faced only 3.3 per cent deficit during the fiscal 2013, the lowest among the major regions in the country, showing also a steep drop from 11 per cent in FY12, 13+ per cent during the earlier two years and around 16 per cent during 2007-08 and 2008-09. The steep fall in deficit during the fiscal 2013 was due to a double digit increase in availability, to be viewed against just one per cent increase in power requirement.
Northern region faced 9.2 per cent, Southern region 15.5 per cent and Eastern region 4.6 per cent deficit. Among the major states, the largest consumer Maharashtra encountered only 3.3 per cent shortfall, against 16.6 per cent average in the fiscal 2011 and 2012 and 18-21 per cent in earlier three years. The dramatic improvement in Maharashtra power situation, relative to the fiscal 2012, resulted from surprisingly a 13 per cent drop in power requirement, even as power availability was marginally better. Madhya Pradesh also faced a lower shortfall of 9.7 per cent, as compared to 16.9 per cent in the preceding year. Gujarat has been placed much comfortably in power supply: it faced only a nominal 0.2 per cent (0.4 per cent) deficit during the year. Uttar Pradesh had to contend with a steeper 16.6 per cent deficit (11.3 per cent). The three major southern region states Karnataka, Andhra Pradesh and Tamil Nadu also faced harsher shortfalls of 13.9 per cent, 17.6 per cent and 17.5 per cent, against 11.2 per cent, 7.2 per cent and 10.5 per cent respectively in the preceding fiscal.
Working Group for the 12th Plan has estimated a requirement of 1,403 billion kwh by FY17, after taking into account energy conservation measures and demand–supply management. Without such measures, the generation requirement is projected at 1463 billion kwh. Even if the moderate level of 1,403 billion kwh is taken as the XII Plan target, the projected growth rate in power generation will be 9.8 per cent.
According to Planning Commission, with the capacity addition of 88,537 mw planned from conventional sources for the 12th Five Year Plan on an All India basis, the projected demand for the power on an all-India basis is likely to be fully met by FY17, the terminal year of the XII Plan. The Government has advised various states to expedite the process of power procurement, in accordance with their demand supply scenario.
Outlook
The outlook on the power sector looks reasonably good, so far as data goes. However, there are certain under-currents which have the potential to impact power sector badly.
Here, the mismatch between fuel pricing and electricity pricing is fast emerging as a major block to generation particularly in thermal power that constitutes three-fifths of power source. The country is increasingly faced with acute shortage and escalating prices for coal and gas that fire thermal power stations. The malaise of inadequate availability of coal and gas and lack of affordability even where they are available, could cramp PLF of running power stations, negating partially the benefits of capacity addition.
Thermal power stations are squeezed between reforms-bearing economic pricing of coal and gas on the one hand and contained (largely) electricity pricing due to inadequate and ineffective reforms in this area on the other. The problem gets aggravated due to inefficient power distribution that causes T&D losses, which further cut into margins.
Thus, unless the issues on pricing and distribution efficiency and effectiveness of existing power infrastructure are addressed in tandem with those relating to capacity augmentation, energy security and its universal availability at affordable cost may still remain elusive.